Identify Tracker Problems to Maximise Energy Production
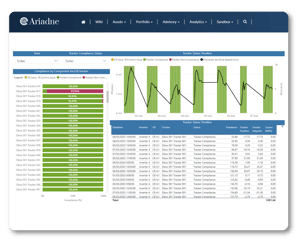
This case study details the successful implementation of an automated weekly solution for calculating and providing PV asset managers with a list of trackers showing their position with respect to the defined setpoint, and calculating the percentage of non-compliance periods. The solution also ranks the trackers from the highest to the lowest percentage of noncompliance, and estimates the production losses caused by noncompliance. This solution significantly improved operational efficiency, decision making and production management in a portfolio of three photovoltaic plants in Spain with an average of 60MW.
CONTEXT
The client, a leading renewable energy company (Independent Power Producer or IPP), managed a set of three photovoltaic plants in Spain with tracking systems to maximise solar radiation capture. Ensuring that the trackers are properly aligned with the defined setpoints is crucial for optimal energy production.
CHALLENGES
The client faced the following challenges:
- Manual Analysis: The need to download data and perform setpoint compliance analysis manually in MS Excel at tracker level was highly inefficient and demanded a considerable investment of time and effort by the management team.
- Optimising Production: The lack of an automated solution limited the ability to detect setpoint noncompliance problems, estimate associated losses and maximise asset energy.
- Informed Decision Making: The lack of metrics and reporting made it difficult for the management team to make informed, data-driven decisions.
SOLUTION
Quintas Analytics developed and implemented a comprehensive automated solution that addressed the challenges mentioned above:
- Advanced Analytics Platform: A platform was designed to collect, integrate and analyse tracker position data.
- Calculation of Availability and Performance: Algorithms were implemented to calculate the availability of strings and compare their performance with the values guaranteed by the manufacturers of the PV panels installed at the plant.
- Calculation of Percentage of Non-compliance: Algorithms were implemented to calculate the percentage of periods in which trackers were outside the defined setpoint.
- Loss Estimates: The solution automatically ordered the trackers by highest to lowest percentage of non-compliance and estimated the associated production losses based on the production of the strings related to each tracker.
- Automatic Notifications: Weekly notifications were set up for asset managers, providing a list of trackers with their default percentage and estimated losses.

RESULTS AND BENEFITS
Implementing the solution had a positive impact on operational management and energy production:
1. Efficiency and Time Saving: The automated solution eliminated the need for manual downloading, cleaning, data integration and analysis in MS Excel by the operational team, saving time and improving efficiency.
2. Production Optimisation: Early identification of setpoint non-compliance enabled a rapid response by operations and management, maximising energy production.
3. Informed Decision Making: The ordering and estimation of losses facilitated data-driven decision making and improved prioritisation of actions by the operator.
4. Loss Reduction: Early detection of non-compliance helped to minimise associated production losses and optimise revenue.
CONCLUSIONS
The solution implemented for the automated monitoring of PV trackers, analysis of percentage of non-compliance against setpoint and estimation of losses across a portfolio of PV plants proved a success story regarding improved efficiency and energy production. Automated analysis and weekly notifications provided essential tools for effective and cost-efficient management. This solution sets a valuable example for the management of similar projects in the field of solar PV.
